
Last August, I wrote about the differing outcomes of the two Intensive Elementary French sections I taught: one remote synchronous, the other remote asynchronous. My write-up included some descriptive statistics, and ultimately concluded that learners in the synchronous course achieved higher scores than those in the asynchronous course. At the time I wrote the post, my statistical literacy was less than it is now, so the purpose of the present post is to determine whether these findings were statistically significant.
I. Do final course grades differ between the two modalities?
I took the two sections, asynchronous (n = 19) and synchronous (n = 10), and conducted a two-sample t-test to determine whether there is a meaningful, measurable difference in the average final course grade for each modality. The data from each section were normally distributed according to visual testing and the Shapiro-Wilk test (asynchronous p = 0.12, synchronous p = 0.26). An F-test revealed that the data were not of equal variance (F = 13.66, p < 0.001, 95% CI [3.69, 40.01]). The Welch two-sample t-test revealed a statistically significant, large difference between the asynchronous and synchronous sections (t(22.49) = 3.87, p < 0.001, d = 1.29, 95% CI [-2.04, -0.53]). The observed difference in means was -26.46, with a 95% CI [-40.63, -12.29]. A post-hoc test revealed an actual power of 0.80.
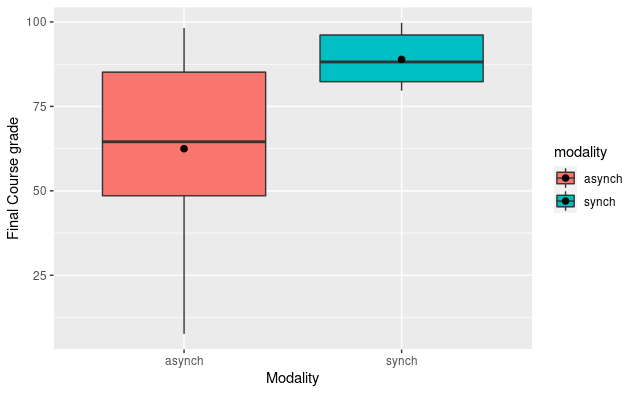
As you can see from the visualization, the learners in the asynchronous course had a much wider spread of final grades, compared to the learners in the synchronous course. The huge, statistically significant difference between the modalities can be seen most glaringly: nearly 75% of the synchronous scores fall within just the fourth quartile of asynchronous scores.
II. Do average scores on each module differ between the two modalities?
The next question is to see where this difference is borne out in the individual modules. When separating the data according to scores by module for each modality, I used visual testing and the Shapiro-Wilk test, determining that, except for Modules 6 and 9, the asynchronous module scores are not normally distributed. For the synchronous scores, only modules 5, 6, 7, 9, and 11 were normally distributed.
| Module | Shapiro-Wilk p value |
| 1 | < 0.001 |
| 2 | < 0.001 |
| 3 | < 0.001 |
| 4 | < 0.01 |
| 5 | < 0.01 |
| 6 | = 0.07 |
| 7 | = 0.02 |
| 8 | = 0.03 |
| 9 | = 0.09 |
| 10 | < 0.001 |
| 11 | < 0.01 |
| 12 | < 0.001 |
| Module | Shapiro-Wilk p value |
| 1 | < 0.001 |
| 2 | = .03 |
| 3 | < 0.001 |
| 4 | < 0.01 |
| 5 | = 0.23 |
| 6 | = 0.29 |
| 7 | = 0.59 |
| 8 | = 0.03 |
| 9 | = 0.85 |
| 10 | < 0.001 |
| 11 | = 0.06 |
| 12 | < 0.001 |
I attempted to transform the data using log10 and square root functions, to no success. Since none of the comparisons will be made using fully normally-distributed data, I skipped testing for equal variance and moved on to conducting non-parametric Kruskal-Wallis tests. Since these can’t replace two-way ANOVA, I ran multiple tests on the different subsets of the data.
For the asynchronous class, no significant difference between module scores was found (chi² = 98.16, p = 0.06, df = 78). Likewise, there was no significant difference for the synchronous class module scores (chi² = 51.30, p = 0.38, df = 49). I can conclude then that no individual module was meaningfully more difficult than the others, for either population of students.
Additionally, based on the earlier t-test of the final course grade, which is entirely dependent on the summation of students’ individual module scores, it’s no surprise that a significant difference was found based on modality alone (chi² = 135.60, p < 0.01, df = 92).
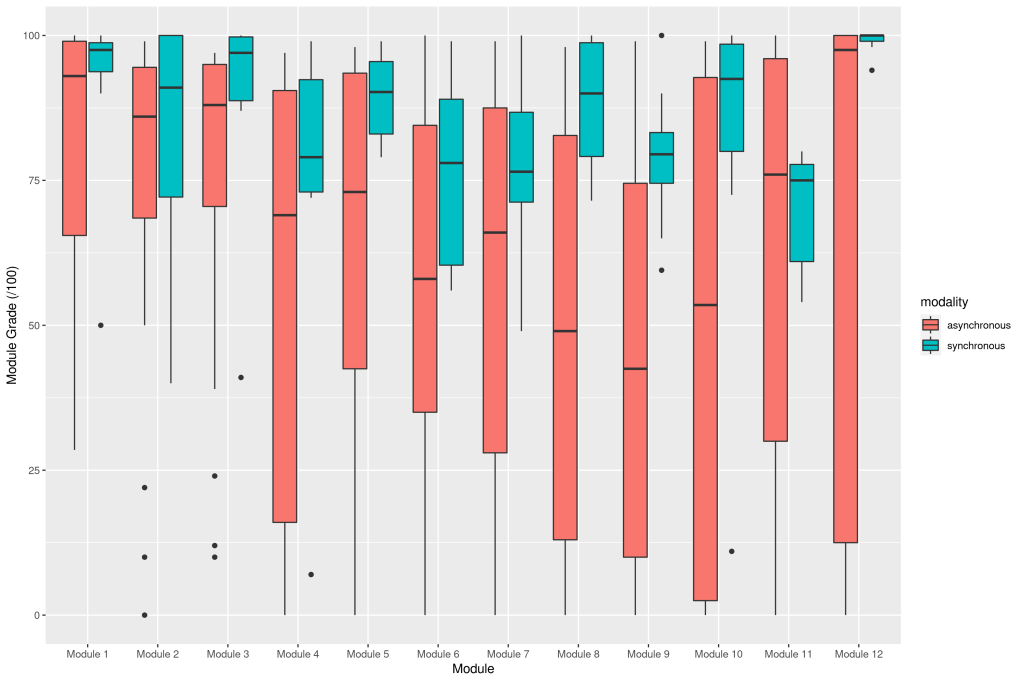
The visualization above shows the stark difference in individual module grades by modality, revealing especially the wide range in asynchronous student scores starting with Module 4. This distinction is sharpest with the Module 12 comparison. The lowest outlier score from the synchronous students was 94, which nearly half of the asynchronous scored below (median = 94.75). In two-thirds of the modules (excepting Modules 1, 2, 7, and 11), half of asynchronous students scored below nearly all of the synchronous students.
III. Comparisons using only the top 50% of asynchronous scores
This is not to say that asynchronous courses should be avoided; some students in the asynchronous class achieved as high as the highest-performing students in the synchronous class. Since individual module grades were comprised of discrete tasks (auto-graded textbook activities, online discussions, group projects, and learning reflections), the lowest module scores can be primarily attributed to students neglecting to complete all of the tasks.
| Asynchronous max score | Synchronous max score | |
| Module 1 | 100 | 100 |
| Module 2 | 99 | 100 |
| Module 3 | 97 | 100 |
| Module 4 | 97 | 99 |
| Module 5 | 98 | 99 |
| Module 6 | 100 | 99 |
| Module 7 | 99 | 100 |
| Module 8 | 98 | 100 |
| Module 9 | 99 | 100 |
| Module 10 | 99 | 100 |
| Module 11 | 100 | 80 |
| Module 12 | 100 | 100 |
| Final grade | 98.22 | 99.74 |
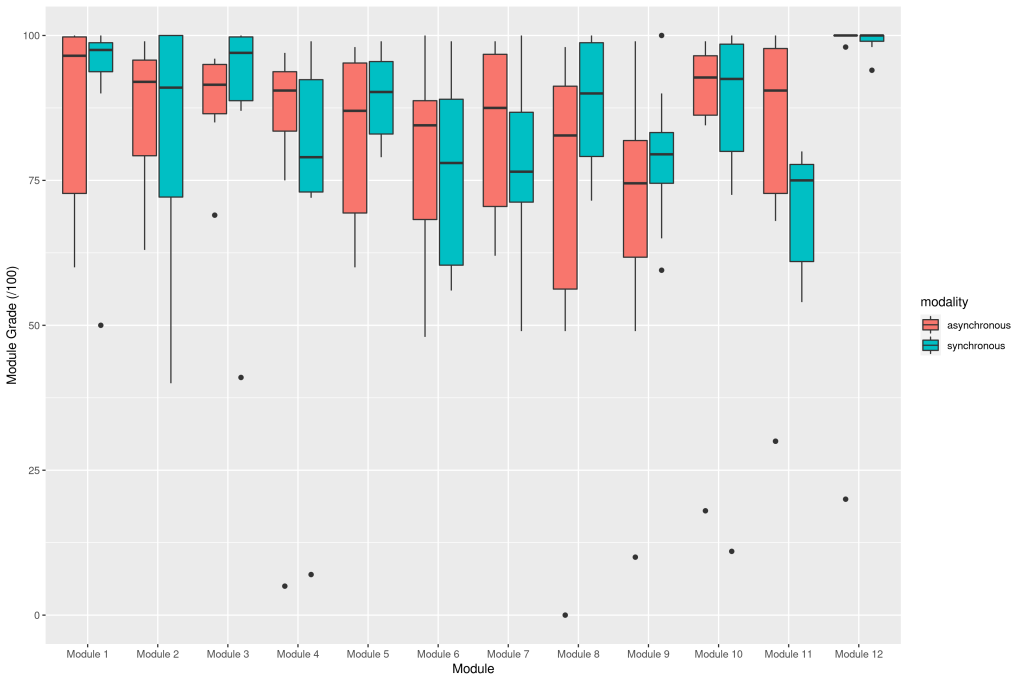
Given the earlier finding that the median score on each module for the asynchronous section fell at the bottom of the distribution for the synchronous scores, and the likelihood that these low scores resulted from not submitting several tasks per module, I’m selecting the top 50% (n = 10) of the asynchronous students as a proxy for engagement. Controlling the data in this fashion, I ran another Kruskal-Wallis test, finding no significant difference in module score by modality (chi² = 79.94, p = 0.20, df = 70). Additionally, when looking at only the final grade data, both sections’ scores are normally distributed according to visual testing and the Shapiro-Wilk test (synch p = 0.26, asynch p = 0.69), and are of equal variance according to the F test ( F = 2.17, p = 0.26). The subsequent t-test found no significant difference in mean final grade by modality (t(18) = 1.31, p = 0.21).
IV. Conclusions
Students enrolled in the asynchronous Intensive Elementary French section achieved a statistically significantly lower course grade on average compared to students in the synchronous section. This trend tracks across each of the twelve course modules, often with a full half of the asynchronous students scoring below the lowest synchronous student for a given module. Importantly, within each modality, there was no significant difference in mean scores by module, so the final course grades were not skewed by a particularly difficult (or lenient) module. Although I no longer have access to LMS engagement metrics, I ascribe these score differences to lack of asynchronous students’ engagement, based on the module scores resulting from missing task submissions. Subsetting the asynchronous section by the top 50% of final course grade (as a proxy for students who handed in a number of tasks indicative of consistent course engagement), ANOVA testing found no significant difference in module grade by modality. Likewise, a two-sample t-test found no significant difference in final course grade by modality.
To echo my earlier conclusions, it’s probable that the synchronous students felt more accountable to hand in their work when they met with me (and our teaching assistant) over Zoom twice a week (once per module). For asynchronous students, my presence could only be felt through emails, announcements (both video and textual), and participation within asynchronous discussion assignments (both video and textual). Students who did not participate in the discussion assignments, read my emails, or watch my video announcements were able to completely avoid interacting with me–avoiding any implicit accountability. Unfortunately, I lacked the foresight to save the LMS interaction data before it was scrubbed from the servers, so this will have to be an avenue for future study.
